


Nationwide, intersections are a major source of traffic collisions and traffic injuries. In fact, researchers estimate that nearly half of all traffic collision injuries are intersection-related.
With that in mind, are Bexar County motorists at higher risk of being involved in a collision? If so, where are the most dangerous intersections in the county? What can we do to help increase safety on our roads in San Antonio?
In order to find out, the San Antonio car accident attorneys at Villarreal & Begum worked with data visualization and data analysis firm 1point21 Interactive. Together we analyzed data from all motor vehicle collisions that occurred in Texas in 2020 – more than 540,000 records – and isolated those that occurred at intersections in Bexar County. Additionally, we compared data from 2020 to 2019 to examine the impact that the COVID-19 pandemic and ensuing response have had on motor vehicle collisions in the county.
[Interactive Map] Bexar County Intersection Collisions
The map below shows all Bexar County road crossings where at least one collision occurred in 2020. The size of the circle is based on each intersection’s collision injury score(CIS). The map is interactive and users may zoom in and out and hover over each point to reveal more information.
*If viewing on a mobile device, rotate the device for the best experience.
The State of Bexar County Collisions
In 2020, there were nearly 50,000 crashes in Bexar County. These collisions resulted in 16,781 injuries and 199 deaths.
Overall, just over 30 percent of Bexar traffic collisions and 40 percent of traffic injuries occurred at intersections – meaning the collision physically occurred within a crossing. This is slightly higher, but right in line with Texas as a whole, where intersections account for 29 percent and 39 percent respectively.
However, when you include collisions that were flagged to be intersection related – those where the flow of traffic from or other factors related to the intersection were involved in the collision – those numbers jump to 43 percent of all collisions and 55 percent of injuries.
100 Most Dangerous Intersections in Bexar County
After analyzing the crash data, we ranked each intersection based on our collision injury score (CIS) – a formula that weighs collision volume and injury severity at each crossing to create a score. Based on that metric, below are the 100 most dangerous intersections in Bexar County.
| Rank | Intersection | Crashes | Susp. Serious Injury | Total Injuries | Fatalities | CIS |
|---|---|---|---|---|---|---|
| 1 | HWY 151 & LOOP 410 | 65 | 4 | 38 | 0 | 312.5 |
| 2 | BANDERA RD & LOOP 1604 | 51 | 0 | 37 | 0 | 253.5 |
| 3 | LOOP 1604 & HWY 281 | 63 | 1 | 30 | 0 | 238 |
| 4 | LOOP 410 & SAN PEDRO AVE | 52 | 0 | 32 | 0 | 222 |
| 5 | IH 10 & LOOP 1604 | 60 | 3 | 26 | 0 | 220 |
| 6 | RIGSBY AVE & LOOP 410 | 52 | 1 | 28 | 0 | 219.5 |
| 7 | LOOP 410 & OLD SEGUIN RD | 44 | 1 | 22 | 1 | 191.5 |
| 8 | IH 35 & WALZEM RD | 42 | 2 | 20 | 1 | 187 |
| 9 | STATE HWY 151 & W MILITARY DR | 44 | 0 | 26 | 0 | 186.5 |
| 10 | ALAMO RANCH PKWY & WESTWOOD LOOP | 66 | 1 | 19 | 0 | 181 |
| 11 | WETMORE RD & WURZBACH PKWY | 34 | 1 | 21 | 0 | 156.5 |
| 12 | POTRANCO RD & LOOP 1604 | 29 | 0 | 21 | 0 | 149 |
| 13 | MARBACH RD & LOOP 410 | 51 | 0 | 19 | 0 | 146 |
| 14 | LOCKHILL SELMA RD & LOOP 1604 | 25 | 0 | 22 | 0 | 142.5 |
| 15 | HWY 281 & STONE OAK PKWY | 28 | 0 | 19 | 0 | 140.5 |
| 16 | FREDERICKSBURG RD & WURZBACH RD | 36 | 0 | 16 | 0 | 136 |
| 17 | CULEBRA RD & LOOP 1604 | 43 | 1 | 14 | 0 | 128 |
| 18 | HUEBNER RD & IH 10 | 39 | 0 | 17 | 0 | 126.5 |
| 19 | INGRAM RD & LOOP 410 | 35 | 0 | 18 | 0 | 125 |
| 20 | W MILITARY DR & HWY 90 | 40 | 0 | 14 | 0 | 122.5 |
| 21 | IH 10 & WURZBACH RD | 39 | 1 | 14 | 0 | 121.5 |
| 22 | LOOP 1604 & SCHUWIRTH RD | 2 | 1 | 16 | 0 | 119.5 |
| 23 | CALLAGHAN RD & CULEBRA RD | 38 | 1 | 14 | 0 | 118 |
| 24 | CALLAGHAN RD & FREDERICKSBURG RD | 15 | 0 | 16 | 0 | 117.5 |
| 25 | DE ZAVALA RD & IH 10 | 40 | 0 | 14 | 0 | 117.5 |
| 26 | INGRAM RD & POTRANCO RD | 17 | 2 | 14 | 0 | 114.5 |
| 27 | CERALVO & S GENERAL MCMULLEN | 16 | 1 | 16 | 0 | 113.5 |
| 28 | E HOUSTON ST & E IH10 | 12 | 0 | 18 | 0 | 112 |
| 29 | CASTROVILLE RD & S GENERAL MCMULLEN | 19 | 0 | 16 | 0 | 111.5 |
| 30 | BANDERA RD & LOOP 410 | 26 | 0 | 16 | 0 | 111 |
| 31 | IH 35 & LOOP 1604 | 52 | 0 | 8 | 0 | 109.5 |
| 32 | SAN PEDRO AVE & W ELMIRA ST | 23 | 0 | 15 | 0 | 108 |
| 33 | CULEBRA RD & LOOP 410 | 38 | 0 | 12 | 0 | 105.5 |
| 34 | N ZARZAMORA ST & W COMMERCE ST | 20 | 0 | 16 | 0 | 105 |
| 35 | HORAL DR & MARBACH RD | 24 | 0 | 11 | 1 | 104 |
| 36 | EVANS RD & HWY 281 | 39 | 1 | 11 | 0 | 104 |
| 37 | CULEBRA RD & WESTOVER HILLS BLVD | 13 | 0 | 15 | 0 | 103 |
| 38 | S GENERAL MCMULLEN & W COMMERCE ST | 22 | 0 | 15 | 0 | 99.5 |
| 39 | BANDERA RD & ECKHERT RD | 16 | 1 | 13 | 0 | 98.5 |
| 40 | BANDERA RD & MAINLAND DR | 11 | 2 | 13 | 0 | 98.5 |
| 41 | LA MANDA BLVD & VANCE JACKSON RD | 15 | 1 | 13 | 0 | 97.5 |
| 42 | CULEBRA RD & ROFT RD | 7 | 1 | 13 | 0 | 97 |
| 43 | FM 78 & PAT BOOKER RD | 22 | 0 | 13 | 0 | 97 |
| 44 | BANDERA RD & HILLCREST DR | 22 | 0 | 14 | 0 | 97 |
| 45 | FREDERICKSBURG RD & HUEBNER RD | 24 | 0 | 14 | 0 | 96.5 |
| 46 | BLANCO RD & LOOP 1604 | 26 | 0 | 13 | 0 | 96 |
| 47 | POTRANCO RD & TALLEY RD | 18 | 0 | 12 | 0 | 95.5 |
| 48 | LOOP 410 & WEST AVE | 18 | 2 | 10 | 0 | 95.5 |
| 49 | IH 35 & LOOP 410 | 29 | 0 | 11 | 0 | 94 |
| 50 | CROSSWINDS WAY & TECH COM DR | 9 | 4 | 10 | 0 | 94 |
| 51 | PLEASANTON RD & SW MILITARY DR | 14 | 0 | 14 | 0 | 91.5 |
| 52 | FM 78 & N FOSTER RD | 19 | 1 | 11 | 0 | 91.5 |
| 53 | NACOGDOCHES RD & WURZBACH PKWY | 19 | 0 | 12 | 0 | 91.5 |
| 54 | BANDERA RD & TIMCO WEST | 6 | 0 | 15 | 0 | 91 |
| 55 | BOERNE STAGE RD & IH 10 W | 15 | 0 | 14 | 0 | 90 |
| 56 | NOT REPORTED & NOT REPORTED | 23 | 0 | 13 | 0 | 88 |
| 57 | CASTLE CROSS DR & RITTIMAN RD | 17 | 1 | 12 | 0 | 87 |
| 58 | N PECOS LA TRINIDAD & W MARTIN ST | 21 | 0 | 12 | 0 | 86 |
| 59 | POTRANCO RD & STATE HWY 151 | 23 | 1 | 10 | 0 | 85.5 |
| 60 | CULEBRA RD & CULEBRA RD | 20 | 0 | 11 | 0 | 85 |
| 61 | E SOUTHCROSS BLVD & S WW WHITE RD | 17 | 0 | 12 | 0 | 84.5 |
| 62 | S PRESA ST & SE MILITARY DR | 14 | 0 | 12 | 0 | 84 |
| 63 | NOT REPORTED & NOT REPORTED | 29 | 1 | 8 | 0 | 84 |
| 64 | S GENERAL MCMULLEN & WEIR AVE | 11 | 0 | 12 | 0 | 83.5 |
| 65 | N HUNT LN & HWY 151 | 18 | 0 | 10 | 0 | 83 |
| 66 | CROSSWINDS WAY & OCONNOR RD | 18 | 0 | 13 | 0 | 83 |
| 67 | CULEBRA RD & PIPERS CREEK | 14 | 0 | 9 | 1 | 81.5 |
| 68 | ELM TRL & WALZEM RD | 11 | 3 | 9 | 0 | 81 |
| 69 | HWY 211 & POTRANCO RD | 18 | 0 | 9 | 0 | 80.5 |
| 70 | LOOP 410 & PERRIN BEITEL | 20 | 0 | 12 | 0 | 80 |
| 71 | ROOSEVELT AVE & S FLORES ST | 12 | 1 | 10 | 0 | 79.5 |
| 72 | E QUINCY ST & MCCULLOUGH AVE | 18 | 0 | 10 | 0 | 78 |
| 73 | IH 35 & W THEO | 20 | 0 | 11 | 0 | 77.5 |
| 74 | LOCKHILL SELMA RD & WURZBACH RD | 17 | 0 | 10 | 0 | 77 |
| 75 | LOOP 1604 & NACOGDOCHES RD | 32 | 0 | 9 | 0 | 77 |
| 76 | DIVISION & PLEASANTON RD | 8 | 0 | 10 | 1 | 75.5 |
| 77 | BENTLEY DR & WALZEM RD | 9 | 2 | 9 | 0 | 74 |
| 78 | CULEBRA RD & TIMBER VIEW DR | 13 | 1 | 9 | 0 | 73 |
| 79 | MCCULLOUGH AVE & NE 410 LOOP | 23 | 0 | 10 | 0 | 73 |
| 80 | IH 35 & STARLIGHT TERRACE | 15 | 1 | 6 | 1 | 72.5 |
| 81 | N EVANS RD & N NOT REPORTED | 10 | 0 | 9 | 0 | 72.5 |
| 82 | FM 1516 & FM 78 | 17 | 0 | 9 | 0 | 72 |
| 83 | BABCOCK RD & PRUE RD | 12 | 0 | 10 | 0 | 72 |
| 84 | BANDERA RD & STONECROFT | 17 | 0 | 10 | 0 | 72 |
| 85 | S ZARZAMORA ST & SW MILITARY DR | 16 | 0 | 9 | 0 | 71 |
| 86 | S NEW BRAUNFELS AVE & STEVES AVE | 11 | 1 | 8 | 0 | 71 |
| 87 | UTSA BLVD & HWY 10 | 21 | 0 | 9 | 0 | 71 |
| 88 | KITTY HAWK RD & TOEPPERWEIN RD | 17 | 0 | 6 | 1 | 69.5 |
| 89 | PAT BOOKER RD & VILLAGE OAK DR | 22 | 1 | 6 | 0 | 69.5 |
| 90 | CAMP BULLIS RD & NOT REPORTED | 19 | 0 | 10 | 0 | 69 |
| 91 | E CHAVANEAUX RD & ROOSEVELT AVE | 21 | 0 | 9 | 0 | 68.5 |
| 92 | NW 26TH ST & W POPLAR ST | 3 | 2 | 4 | 2 | 68 |
| 93 | CULEBRA RD & N ELMENDORF ST | 15 | 0 | 10 | 0 | 67.5 |
| 94 | CALLAGHAN RD & INGRAM RD | 10 | 0 | 11 | 0 | 67.5 |
| 95 | FM 78 & GIBBS SPRAWL RD | 15 | 0 | 10 | 0 | 67.5 |
| 96 | BABCOCK RD & HILLCREST DR | 15 | 0 | 7 | 0 | 67.5 |
| 97 | FM 1518 & FM 78 | 10 | 0 | 10 | 0 | 67.5 |
| 98 | IH 10 & VANCE JACKSON RD | 17 | 0 | 10 | 0 | 67 |
| 99 | CRESTWAY RD & FM 1516 | 7 | 3 | 6 | 0 | 67 |
| 100 | BABCOCK RD & W HAUSMAN RD | 12 | 0 | 10 | 0 | 67 |
Loops, Highways, and Intersections
The most dangerous intersection in Bexar County can be found at Highway 151 and Loop 410 in San Antonio. It accounted for the second most crashes (64), the most total injuries (38), and the most serious injuries (4) among Bexar County intersections.
Why? This location actually encompasses multiple road crossings including the on and off-ramps of both highways as well as the access roads for each. While they are not what one would consider a traditional intersection, we felt that it was important to include both highways and loops in our analysis when crashes met the conditions of our study ( TxDOT deemed that it was at an intersection).
What this data analysis shows, unequivocally, is that drivers in Bexar County need to be especially aware of their surroundings when going through interchanges on or driving near either one of the major loops. In fact, 23 of the 100 most dangerous intersections and eight of the top ten involve either Loop 410 or Loop 1604.
Coming in at number 16, the most dangerous traditional intersection in Bexar County is Fredericksburg Road and Wurzbach Road in San Antonio. This crossing accounted for 36 crashes and 16 total injuries in 2020.
How did COVID-19 Impact Motor Vehicle Accidents in 2020?
No analysis of 2020 motor vehicle collision data would be complete without assessing the impact of the coronavirus pandemic and the ensuing responses. We compared the collision and injury totals from 2020 to 2019 to understand just how much COVID-19 affected crashes (and essentially traffic in general) in Bexar County. The results were dramatic yet somewhat expected.
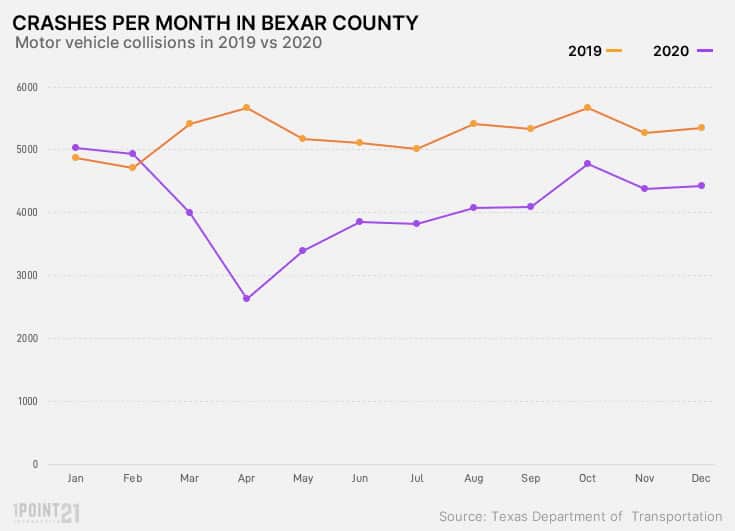
Total Collisions
In March, as responses began to ramp up considerably and the pandemic was declared to be a public health emergency, both total collisions and injuries began to drop precipitously. Collisions fell by 26 percent in March, from 5,420 to 4,002, and by 53 percent in April, from 5,675 to 2,634. By May, collisions began to gradually trend back towards more typical levels yet the yearly total for 2020 was 21 percent lower than 2019.
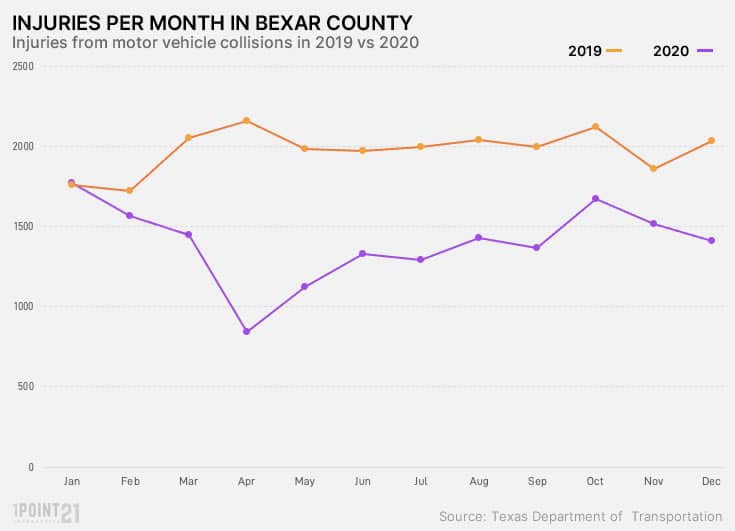
Injuries from Motor Vehicle Collisions
Collision injuries followed a similar, yet even more dramatic pattern – down 29 percent year over year. Injuries dropped 29 percent in March and 61 percent in April before slowly climbing throughout the year. Interestingly, injuries dropped again in November and December as outbreaks raged across the country and experts warned against holiday travel.
Fatalities from Motor Vehicle Collisions
Fatal collisions and traffic deaths occur at a much lower volume and are much more difficult to predict. As a result, they don’t seem to follow the pattern of collisions and injuries at all and actually ended the year with a 9 percent increase over 2019. Given that collisions were down 22 percent and fatalities increased, it appears that the pandemic actually made Bexar County roads considerably more deadly than in 2019.
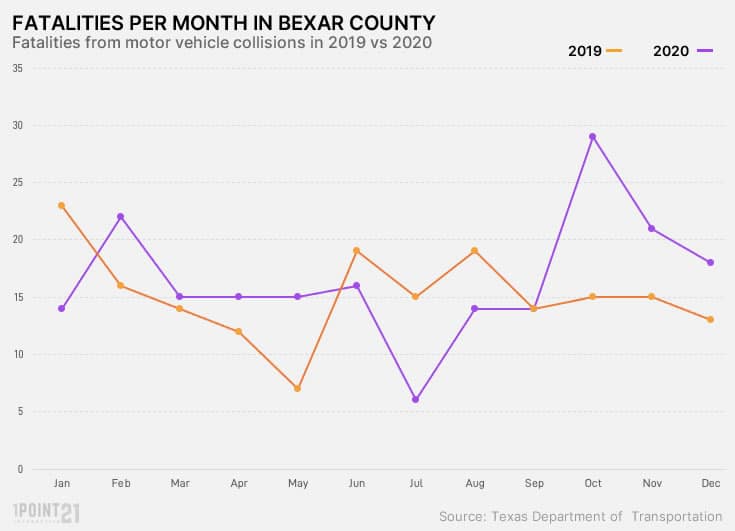
| Month | Crashes 2020 | Crashes 2019 | Injuries 2020 | Injuries 2019 | Fatals 2020 | Fatals 2019 |
|---|---|---|---|---|---|---|
| Jan | 5028 | 4876 | 1774 | 1762 | 14 | 23 |
| Feb | 4943 | 4715 | 1567 | 1722 | 22 | 16 |
| Mar | 4002 | 5420 | 1450 | 2053 | 15 | 14 |
| Apr | 2634 | 5675 | 845 | 2155 | 15 | 12 |
| May | 3386 | 5176 | 1124 | 1984 | 15 | 7 |
| Jun | 3859 | 5115 | 1330 | 1971 | 16 | 19 |
| Jul | 3820 | 5020 | 1289 | 1998 | 6 | 15 |
| Aug | 4081 | 5420 | 1429 | 2038 | 14 | 19 |
| Sep | 4099 | 5337 | 1369 | 1994 | 14 | 14 |
| Oct | 4769 | 5671 | 1673 | 2118 | 29 | 15 |
| Nov | 4386 | 5270 | 1517 | 1856 | 21 | 15 |
| Dec | 4419 | 5349 | 1411 | 2035 | 18 | 13 |
How This Study Can Help
The saying goes that ‘knowledge is power’. We believe understanding where collisions occur and being informed of high-risk areas can empower drivers to adjust their routes and driving behavior accordingly. Through our work, we’ve seen the impact that serious motor vehicle collisions have on people’s lives firsthand. We approached this project with the belief that if our analysis can prevent just one collision it would be worth it.
In addition to reading this study, there are several ways drivers can increase their safety overall:
- Avoid distractive behaviors, including cell phone use, eating and drinking, and anything that takes your eyes off the road.
- Never drink and drive.
- Perform all necessary routine vehicle maintenance.
- If you are drowsy, pull over or allow someone else to drive. Drowsy driving can be nearly as dangerous as drunk driving.
- Maintain a safe distance from other vehicles
- Obey all traffic control devices and speed limits. Especially in intersection collisions, disregarding stop signs, stop lights, and merge signs can significantly increase your likelihood of an accident.
- Don’t expect other drivers to drive safely. While we constantly rely on other drivers to stay safe, being aware of erratic behavior around you can help you preemptively avoid a potential collision.
Data and Fair Use
This study is based on 2020 and 2019 collision data from the Texas Department of Transportation. For more details or information on the study methodology please contact us. If you would like to report on or republish any of the data, maps or images used in this study, please provide Texas Law Guns, Injury & Accident Lawyers credit by linking to this page.

Alexander Begum has tried over 50 trials to verdict and tried or settled over $500 million in cases. Alex is a founding shareholder of the Texas Law Gun, Injury and Accident Lawyers.